Can you guess what will happen if there is no folds in the cerebral cortex ?, there would be extremely great brain ,, in this topic we are talking about the brain gyri and sulci using brain diagrams and images .
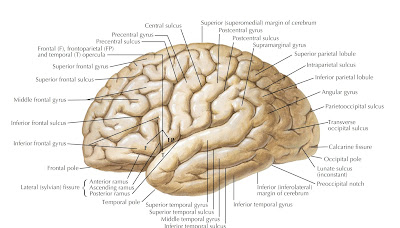
brain diagram describing the lateral surface :
Major dependable landmarks separate the forebrain into lobes; the lateral
(sylvian) fissure separates the temporal lobe below from the
parietal and frontal lobes above, and the central sulcus separates
the parietal and frontal lobes from each other. Several of
the named gyri are associated with specific functional activities,
such as the precentral gyrus (motor cortex) and the postcentral
gyrus (primary sensory cortex). Some gyri, such as the
superior, middle, and inferior frontal and temporal gyri, serve
as anatomical landmarks of the cerebral cortex. The insula,
the fifth lobe of the cerebral cortex, is deep to the outer cortex
and can be seen by opening the lateral fissure.
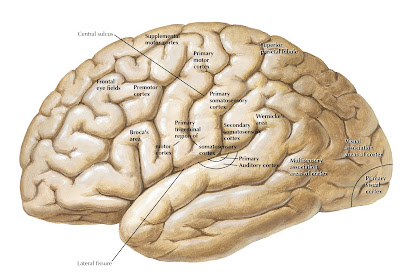
Some circumscribed regions of the cerebral hemisphere are
associated with specific functional activities, including the
motor cortex, the supplemental and premotor cortices, the
frontal eye fields, the primary sensory cortex, and other association
regions of the sensory cortex. Part of the auditory
cortex is visible at the inferior edge of the lateral fissure (the
transverse temporal gyrus of Heschl). Part of the visual cortex
is visible at the occipital pole. Language areas of the left
hemisphere include Broca’s area (expressive language) and
Wernicke’s area (receptive language). Damage to these cortical
regions results in loss of specific functional capabilities.
There is some overlap between functional areas and named
gyri (e.g., the motor cortex and the precentral gyrus), but
there is no absolute concordance.
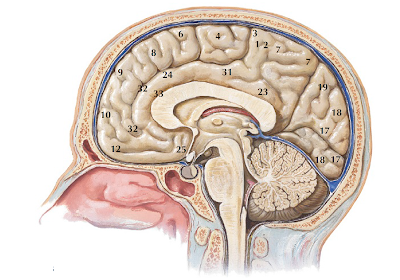
Brodmann’s areas of the cerebral cortex have unique architectural
characteristics in terms of the thickness and layering of
the cerebral cortex; this knowledge is based on histological observations
originally made by Korbinian Brodmann in 1909.
His numbering of cortical areas is still used as a shorthand
for describing the functional regions of the cortex, particularly
those related to sensory functions. Some overlap exists among
functional areas. For example, the motor cortex is area 4; the
primary sensory cortex includes areas 3, 1, and 2; and the primary
visual cortex is area 17.
brain diagram describing the medial surface :
The entire extent of the neuraxis, from the spinomedullary
junction through the brain stem, diencephalon, and telencephalon,
is visible in a midsagittal section. The corpus callosum,
a major commissural fiber bundle interconnecting the
two hemispheres, is a landmark separating the cerebral cortex
above from the thalamus, fornix, and subcortical forebrain
below. The ventricular system, including the interventricular
foramen (of Munro); the third ventricle (diencephalon); the
cerebral aqueduct (midbrain); and the fourth ventricle (pons
and medulla), is visible in a midsagittal view. This subarachnoid
fluid system provides internal and external protection
to the brain and also may serve as a fluid transport system
for important regulatory molecules. The thalamus serves as
a gateway to the cortex. The hypothalamic proximity to the
median eminence (tuber cinereum) and the pituitary gland
reflects the important role of the hypothalamus in regulating
neuroendocrine function. A midsagittal view also reveals the
midbrain colliculi, sometimes called the visual (superior) and
auditory (inferior) tecta.
When the brain stem is removed, a midsagittal view reveals
the C-shaped course of the fornix, extending from the hippocampal
formation in the temporal lobe to the septum and
hypothalamus. Temporal lobe structures, such as the parahippocampal
cortex, the dentate gyrus and fimbria of the hippocampus,
and the uncus (olfactory cortex) also are visible.
In the hypothalamus, the caudal mammillary bodies and the
interconnecting pathway to the thalamus, the mammillothalamic
tract, are revealed.
A, Lobes and functional areas. The cingulate cortex is labeled
the limbic lobe, reflecting its association with other limbic
forebrain structures and with hypothalamic control of the
autonomic nervous system. Functional areas of the cortex,
particularly those involved with vision, are best seen on a
midsagittal view. The sensory and motor cortices associated
with the lower extremities are located medially and are supplied
with blood by the anterior cerebral artery. This region
is selectively vulnerable to specific vascular (anterior cerebral
artery infarct) and mass (parasagittal meningioma) lesions
that result in contralateral motor and sensory deficits of the
lower extremity. B, Brodmann’s areas of the cerebral cortex
are labeled on this midsagittal view of the brain. The major
regions are the primary (17) and associative (18, 19) visual
cortices, and the continuation of areas 4 (motor) and areas
3, 1, and 2 (primary sensory) onto the paracentral lobule in
the midline.
brain diagrams describing the basal surface :
Removal of the brain stem and cerebellum by a cut through the
midbrain exposes the underlying cerebral cortex, the base of
the diencephalon, and the basal forebrain. Basal hypothalamic
landmarks, from caudal to rostral, include the mammillary
bodies, tuber cinereum, pituitary gland, and optic chiasm.
The proximity of the pituitary to the optic chiasm is important
because bitemporal hemianopsia can result from optic
chiasm fiber damage, often an early sign of a pituitary tumor.
The genu and splenium of the corpus callosum are revealed
in this view. In the cross-section of the midbrain, the superior
colliculus, cerebral aqueduct, periaqueductal gray, red nucleus,
substantia nigra, and cerebral peduncles are shown.
This view provides information about the medial temporal
lobe on the left side of the brain, especially cortical regions
associated with the hippocampal formation, the amygdaloid
nuclei, and the olfactory system. On the right side of the brain,
Brodmann’s areas are noted.
brain diagrams using computed tomography scans :
A and B, Computed tomography (CT) is an x-ray–based imaging
approach that is used to view the brain, particularly
when looking for differences in tissue density such as the presence
of blood. The use of spiral (helical) scanners can quickly
provide access to views of slices through the brain at the desired
thickness. CT delineates soft tissue, fluid, and bone and
can be used with contrast to image blood vessels or to reveal
the presence of a tumor caused by a disrupted blood-brain
barrier that allows leakage of the contrast agent into the surrounding
extracellular space of the brain.
brain diagrams using magnetic resonance image axial and cronal t1 weighted images :
A, axial view. B, sagittal view. Magnetic resonance imaging
(MRI) uses short bursts (radiofrequency pulses) of electromagnetic
waves that are sent into the magnet and are absorbed by
protons in the tissues of the patient in the scanner. The pulses
cause alignment of the protons as the result of raised energy
levels; that is followed by a relaxation phase in which the protons
return to a lower energy level. During the relaxation procÂ
ess, a detector records the emitted energy, and a computer
provides a uniform image of the scanned tissue. The intervals
(milliseconds) between the pulses (repetition time, TR) and
the intervals between the collection times of the emitted energy
(echo time, TE) provide various contrast information, which
are indicated by contrast weighting. Short TR and TE intervals
result in T1-weighted images, whereas longer TR and TE intervals
result in T2-weighted images. The T1-weighted images
are particularly useful for viewing normal brain structures and
are particularly useful for viewing the brain stem and the cervical
and thoracic spinal cord. The T2-weighted images are
particularly useful for revealing pathology, such as infarcts,
tumors, edema, and demyelination. A contrast agent such as
gadolinium can be used to delineate a tumor because of its
ability to leak across the blood-brain barrier
brain diagrams using magnetic resonance imaging axial and sagittal t2 - weighted images :
A, axial view. B, sagittal view. T2-weighted images are particularly
useful for imaging the ventricular system and the cisterns
of cerebrospinal fluid.
positron emission tomography scaning :
Positron emission tomography (PET) scanning is designed to
assess the distribution of tracers labeled with positron-emitting
nuclides, such as carbon-11 (11C), nitrogen-13 (13N), oxygen-
15 (15O), and fluorine-18 (18F). Fluorodeoxyglucose (FDG), a
glucose analogue labeled with 18F, can cross the blood-brain
barrier. The metabolic products of FDG become immobile
and trapped where the molecule is first used, thereby permitting
FDG to be used to map glucose uptake in the brain.
This is a valuable tool for investigating subtle physiological
processes related to neurological diseases. The distribution of
FDG can be localized and reconstructed using standard tomographic
techniques that show the tracer distribution throughout
the body or brain. In this example of axial, sagittal, and
coronal views, the transmission measurement and correction
was performed immediately following PET acquisition using a
16-slice CT unit. The PET and CT images were automatically
fused by anatomical coregistration software (shown as colored
images).
In the conclusion I have to notice that we explained good information about the cerebral cortex
and used alot of brain diagrams and images so
i hop it can help
best regards


